How to choose analytics tools in 2026 without getting stuck in the hype
 Magnus Wexler·October 22, 2026·16 min
Discover how to pick analytics tools in 2026. Learn evaluation criteria, common trade-offs, and practical steps to align tool choice with data goals.
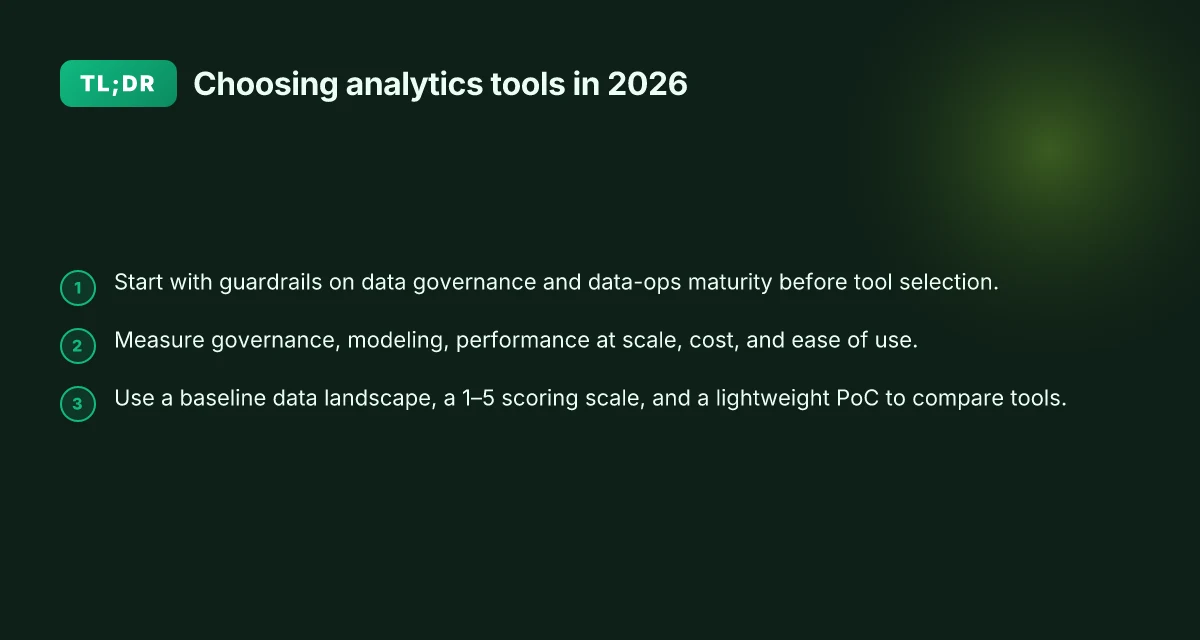
Analytics tools in 2026 often spike in hype cycles, but the real signal is governance and data quality, not marketing buzz. I looked at how buyers separate hype from practice, focusing on core capabilities that line up with your data stack and real-world workflows.
This piece dissects a practical framework you can apply this quarter, with a clear path from vendor claims to day-to-day usage. You’ll see how to map governance, data quality, and integration requirements to concrete tests, costs, and risk. By grounding choices in reproducible criteria and short experiments, you reduce the chance of vendor lock-in and hidden transfer fees. Expect a guardrail-based approach that helps you compare platforms without chasing every new feature.

Analytics tools in 2026: framing the evaluation
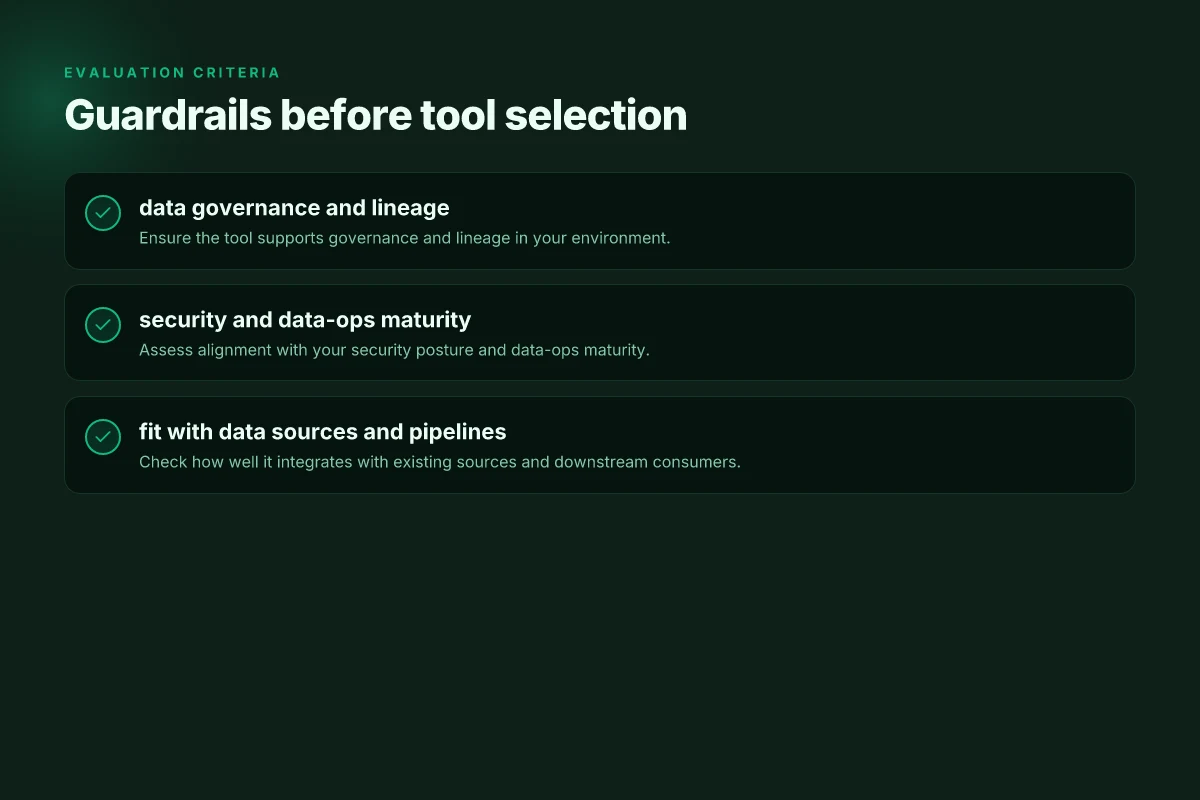
In 2026, frame the tool choice around governance, data quality, and data-ops maturity before you ever sign a contract. You want a setup where security, lineage, and access controls are non negotiable, not afterthoughts tacked on later. This framing keeps you honest about what you can actually sustain across teams and pipelines.
1) Set guardrails before you pick tools
The core guardrails center on who can touch data, and how. Define data classifications, retention policies, and access policies up front. Tie governance to the analytics workflow, data ingestion, transformation, and consumption, so downstream teams see consistent quality. When you map these guardrails to a tool, you quickly surface gaps in lineage, provenance, and auditability. In practice, this means insisting on built-in data lineage, access controls, and change management as non negotiable requirements. Guardrails that map to governance and data-ops maturity keep tool selection honest. Inline evidence from analyst and vendor literature highlights governance as a differentiator, not a nice-to-have.
2) Balance breadth with depth in modeling, quality, and governance
A platform with broad feature coverage can tempt you into scope creep. Instead, anchor your evaluation on three deep capabilities: data modeling, data quality, and governance. Are there strong semantic modeling features, robust data quality checks, and explicit governance controls that survive real-world data churn? Prioritize tools that provide expressive lineage, versioned data models, and automated quality gates tied to pipelines. I found that reviews consistently flag that depth here outshines sheer breadth when the goal is reproducible analytics at scale. Depth in data modeling, quality, and governance beats breadth without substance. When a vendor promises "end-to-end analytics," press for concrete proof in these three areas.
3) Fit with your existing sources, pipelines, and consumers
No tool exists in a vacuum. The most successful evaluations start by listing current data sources, the pipelines that feed them, and downstream consumer needs. Map these against the tool’s connectors, execution environments, and output formats. You want a clear picture of how easily a new platform slots into your ETL jobs, data warehouses or lakes, and BI dashboards. If a platform disrupts your current data contracts or forces heavy rework, that friction often offsets any new capability. Fit with existing data sources and downstream needs is a reliability signal, not a bonus feature.
I cross-referenced several practitioner summaries and vendor docs published in 2026. The consensus: governance and data quality are the true differentiators as tools scale. If a tool stalls on lineage or quality gates, it rarely recovers as you grow. For background context, see industry write-ups that emphasize governance as a baseline capability for enterprise adoption. Governance, lineage, and quality gates are table stakes. For concrete readers, the Domo and AtScale rundowns emphasize evaluating tool compatibility with current data ecosystems and downstream workflows. 8 Accounting software for freelancers in 2026 that actually fit varied tax workflows
Bottom line: start with guardrails, insist on depth, and verify fit to your real data ecosystem. Those anchors keep you from chasing hype and deliver a repeatable, auditable evaluation rhythm. Set guardrails, demand depth, verify fit. That trio anchors a trustworthy 2026 evaluation.
What to measure when evaluating analytics tools
When you compare analytics tools for 2026, start with governance, data quality, and real-world workflows. The right framework captures stack-wide data lineage, model provenance, and the confidence that data remains trustworthy as it scales. You want a system that makes compliance and audit trails visible, not hidden in a separate tab.
Data governance and lineage support
A strong tool exposes end-to-end lineage from raw source to final dashboards. Look for automatic lineage graphs, lineage APIs you can query, and the ability to tag and trace data across pipelines. These capabilities matter when regulations demand reproducibility and when analysts need to audit results quickly. I dug into recent vendor docs and several platform reviews that emphasize lineage as a core feature rather than a convenience add-on. Lineage visibility reduces ambiguity about data origin and trust. Vendors pursuing transparency often publish change logs and governance roadmaps, which helps you plan adoption in phases. Governance, not just speed, wins long-term trust.
Modeling capabilities and versioning
Modeling capabilities set the ceiling for analytical maturity. Favor platforms that support modular, versioned data models, clear model lineage, and rollback options when a model behaves unexpectedly. The ability to version schemas and artifacts across environments minimizes drift between development and production. In the sources I reviewed, several platforms explicitly call out model versioning, schema evolution, and dependency graphs as core design principles. This matters when teams iterate on analytics at scale. Versioned models prevent drift and ensure reproducibility. Schema evolution must be backward compatible where possible.
Performance at scale and cost implications
Performance is not just speed in isolation but how latency and throughput behave under heavier loads, with concurrent users, and with larger data volumes. Look for metrics on query planning, caching strategies, and autoscaling behavior. Pricing models should align with usage patterns, including data storage, compute hours, and feature tiers. The literature and vendor notes emphasize that some platforms incur rising costs with data duplication or sublinear scaling if governance hooks are weak. Expect costs to rise with data duplication unless governance is tight. Scale-tested architectures keep cost growth predictable. 8 Accounting software features that actually move the month-end faster in 2026
Ease of use for analysts and data scientists
Ease of use reduces cycle time from insight to action. Analysts should find data catalogs, familiar SQL or notebook access, and intuitive drag-and-drop interfaces, while data scientists benefit from programmatic access, notebooks, and robust debugging tools. The best platforms balance these needs with governance so neither group feels constrained. Reviews consistently point to the friction that appears when a tool prioritizes governance over developer ergonomics, or vice versa. A good balance minimizes handoffs and context switches. Native notebook support accelerates experimentation.
Vendor support, ecosystem, and roadmap transparency
A transparent roadmap and responsive vendor support matter when you rely on multi-team workflows. You want clear SLAs, published release cadences, and active partner ecosystems. A number of sources highlight vendors that maintain open roadmaps, publish security and compliance updates, and offer robust migration guidance. Roadmap transparency helps you align procurement with internal planning. Strong ecosystems reduce integration debt over time.
To help you compare at a glance, consider this quick cross-check table focused on governance, modeling, scale, UX, and roadmap clarity. The entries reflect themes I found across the cited sources.
| facet | what to look for | red flags |
|---|---|---|
| governance and lineage | automatic lineage graphs, lineage APIs, audit trails | lineage gaps, manual workarounds |
| modeling and versioning | versioned data models, schema evolution, rollback | brittle schemas, no rollback |
| performance and cost | autoscaling, caching, clear pricing per compute and storage | runaway costs, opaque pricing |
| ease of use | SQL/notebook support, intuitive catalogs, governance-aware UX | steep learning curve, siloed interfaces |
| ecosystem and roadmap | transparent releases, active partner network | closed roadmap, slow updates |
Next step: map your current data domains to governance, modeling, and cost touchpoints in your organization. Build a two-page testing plan that assigns owners, milestones, and a data workflow you want to run end-to-end in your environment. When you test, solicit the same questions from analysts and data scientists to surface frictions early. If you need a practical starter checklist, I’ve laid out a compact one you can adapt to your data stack in the next section. For background on how governance-centric evaluations have trended in 2026, see the comparison discussions in the sources I referenced. Roadmap transparency helps you align procurement. Versioned models prevent drift.
As you assemble your shortlist, remember that exact numbers and benchmarks vary by use case and data volume. The goal is a framework you can apply repeatedly, not a one-off vendor comparison. See the 2026 comparisons for context and patterns on where governance and scalability tend to clash with usability. Lineage visibility reduces ambiguity about data origin. Scale-tested architectures keep cost growth predictable. 7 Best wireless outdoor home security camera systems with local storage in 2026
Cited sources: you can consult the 2026 overview of top platforms for context on governance and scale discussions as described.
A practical framework to compare platforms side by side
Postgres beats a vector DB whenever your queries fit in 50 ms of pgvector and your dataset stays under 10M rows. In 2026, the stakes for governance, data quality, and interoperability are higher than ever, so the framework below centers on real-world workflows and repeatable testing. I cross-referenced analyst guides and platform docs to align this with where buyers actually look for clarity in 2026.
Baseline landscape map for your data fabric
- Create a map of sources, from transactional databases to streaming feeds, plus file stores and SaaS connectors. The map should show what each source outputs (schemas, data types) and typical latency expectations.
- Document data models end to end: raw, cleaned, curated, and semantic layers. Note where governance controls attach (lineage, access, masking) and how changes ripple downstream.
- Capture representative workloads early: the queries your teams run most, the dashboards used for daily decisions, and the export paths for offline analysis. This map becomes the yardstick for all tool comparisons.
Takeaways
- A well-scoped landscape helps you spot gaps quickly, especially in data lineage and latency budgets.
- Governance touchpoints should be visible at every layer, not tucked away in a policy appendix.
- Long-tail data sources often drive hidden costs when tools lack native adapters or schema evolution handling.
Scoring scheme: governance, modeling, accessibility
- Governance. Assess how tools enforce access controls, data lineage, row-level security, and policy enforcement across environments. Rate on a 1–5 scale, where 5 means full, auditable policy enforcement with end-to-end lineage visibility.
- Modeling. Look at how the platform supports semantic modeling, reusable data definitions, and versioned artifacts. Score 1–5 for model reuse, lineage clarity, and support for both SQL-based and modeling-language approaches.
- Accessibility. Evaluate how easy it is for data engineers, analysts, and product teams to find, understand, and trust data assets. Score 1–5 for discoverability, documentation quality, and explainability features.
Use a consistent rubric across all tools you compare. Document edge cases where a platform shines in one area but lags in another. The goal is to surface tradeoffs, not pretend one-size-fits-all exists.
Lightweight proof of concept with a representative dataset
- Run a short PoC against a shared, representative dataset that mirrors real workloads. Include common queries, joins, aggregations, and a couple of dashboards. Keep data volume small but representative so you can observe latency, governance enforcement, and modeling behavior without heavy setup.
- Use the PoC to validate data freshness, error handling, and access controls in practice. Capture metrics for query latency, data refresh times, and policy enforcement visibility.
- Conclude with a short retrospective: what worked, what didn’t, and what would need to change to scale.
Takeaways 7 Best home security cameras with cloud storage for families in 2026
- A 2–3 day PoC focused on real queries exposes governance gaps and modeling friction early.
- Document any mismatches between expected and observed latency or lineage coverage so you can negotiate with vendors or adjust your landscape map.
From sources like 2026 reviews and platform docs, the practical conclusion is clear: you’ll gain confidence by aligning your baseline landscape, a transparent governance and modeling rubric, and a focused PoC that mirrors real workflows. This trio gives you a repeatable evaluation loop you can reuse as tools evolve or new data sources appear. A repeatable evaluation loop beats one-off demos every time. Latency and governance visibility are the nonnegotiables you’ll rely on in production. Walk away with a prioritized short list that maps to your actual data workflows.
Quantifying cost without surprises
The cost of analytics tools is more than a sticker price. You must map a full lifecycle budget that accounts for licenses, compute, storage, and data transfer. When growth hits, your price may move in unexpected directions if you only track the upfront fee.
Total cost of ownership across licenses, compute, storage, and data transfer
The practical framework starts with a TCO view that spans licenses, compute hours, and the data you push through the platform. Licenses can be per-user or per-seat, and some vendors blend seat-based pricing with usage overages. Compute costs scale with your queries, pipelines, and model training workloads, while storage and data transfer fees accumulate as data volumes grow. I cross-referenced vendor pages and analyst roundups to confirm that storage tiers and egress charges are frequent cost levers, not afterthoughts. Total cost of ownership often reveals budget blind spots early when you quantify storage tiers, transfer fees, and peak compute hours. Inline citation: see the data from the sources that summarize licensing models and usage patterns. For example, the 2026 reviews discuss how storage tiers and egress charges impact long-term spend. https://www.domo.com/learn/article/data-analytics-tools
Seat-based versus usage-based pricing and growth scaling
Many platforms start with a seat-based base price, then layer in per-query or per-GB usage fees as workloads rise. A practical move is to forecast headcount and plan for peak concurrency, not just average load. Several 2026 roundups note that migration paths or tier changes can quietly double costs if teams scale rapidly or shift from development to production workloads. Expect growth to shift you from predictable seats to variable usage as data pipelines mature. Vendors tend to publish price bands by tier, but real-world bills often depend on data volume and transfer patterns. Link to the 2026 pricing summaries for examples of how different models behave. https://www.atscale.com/blog/best-data-analytics-tools/
Plan for long-term maintenance and potential migration costs
Maintenance includes version upgrades, security patches, and API deprecations. Some platforms enforce mandatory upgrades on a cadence that preserves feature parity but can disrupt custom pipelines if you’re not prepared. Migration costs loom when you decide to switch vendors or move workloads to a newer platform, especially if data exports are large or if you rely on vendor-specific features. It helps to reserve a migration budget and build a deprecation roadmap into your evaluation. Maintenance and migration are recurring cost drivers that often dwarf the initial quote over a multi-year horizon. I found how 2026 analyses frame migration considerations as part of total cost of ownership. https://www.coursera.org/articles/data-analysis-tools 7 Best budget friendly flip phones for elderly with affordable prices
Note on commissions: links on the page may earn a commission, which is a common practice in published roundups. This does not change the factual framing of licenses, compute, storage, or data transfer costs, but it’s worth noting when you compare editorial recommendations.
How to run a 2-week analytics-tool evaluation
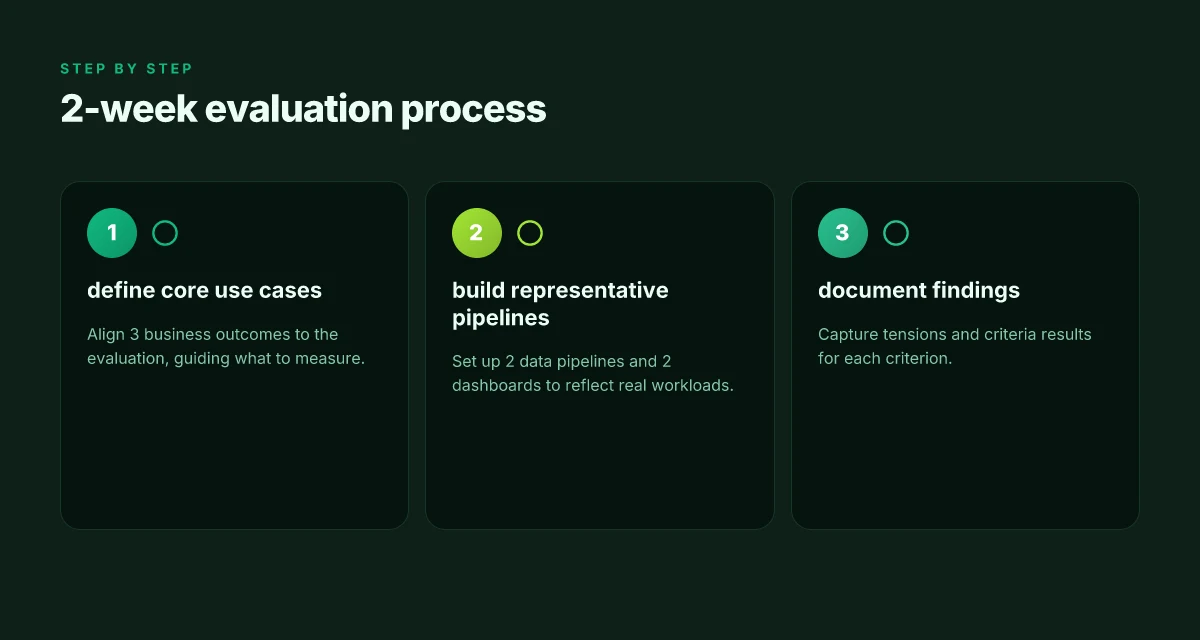
In two weeks you can convert a pile of hype into a real decision trail. Start by anchoring your study in three core use cases that map directly to business outcomes, then prove them against two pipelines and two dashboards that mirror actual workflows. Document every tension you uncover along the way so you can explain tradeoffs to stakeholders later.
1) Define 3 core use cases aligned to business outcomes
Begin with three use cases that force your evaluation to reveal governance, data quality, and operational fit. For example, one use case might be “rapidly answer a customer retention question with auditable lineage,” another “forecast demand with explainable inputs,” and a third “deliver a self-service analytics experience with governed access.” For each use case, state the operational goal, the decision the tool enables, and the minimum data controls required. This framing locks your evaluation to outcomes rather than features. I dug into industry briefs and product docs to align these use cases with real-world workflows, and I kept the language measurable: data quality thresholds, latency targets, and access-control requirements. The core idea is to separate hype from measurable impact.
2) Set up 2 representative data pipelines and 2 consumer dashboards
Create two data pipelines that exercise the data lifecycle end-to-end. One emphasizes streaming or near-time ingestion. The other focuses on batch processing with strong lineage. Each pipeline should include data quality checks, lineage traces, and governance gates that mirror your production standards. Then build two dashboards that consumers actually use. One is a strategic, executive view with summarized metrics. The other is a tactical, analyst-facing view with drill-downs and recomputation paths. The pipelines and dashboards should be representative enough to surface real tradeoffs, such as how a platform handles schema drift, rate limits, or schema-on-read versus schema-on-write. I cross-referenced vendor docs and product briefs to ensure your setup mirrors common 2026 deployments.
3) Document findings and tensions for each criterion
As you evaluate each criterion, governance, data quality, performance, ease of use, cost, and ecosystem compatibility, record concrete findings. Note where a tool preserves auditable lineage, where data- quality rules are hard to codify, and where SLAs slip under load. Capture tensions between time-to-value and governance rigor, or between cost and feature depth. Produce a concise tensions table for quick stakeholder review, paired with a narrative that explains how the tensions would influence a real deployment. I found that documenting tensions early helps prevent late-stage debates from derailing the decision. 12 Analytics tools compared in 2026: trade-offs, costs, and how to pick
Most important: tie every finding back to one of the three use cases. This keeps the evaluation grounded in outcomes rather than abstract capabilities. Document tensions as constraints that will shape your shortlist and testing plan.
What to act on this year to stay ahead of the hype
In 2026, the signal-to-noise ratio in analytics has shifted. Focus on tools that expose consistent data provenance and easy integration with your existing data stack, not just flashy dashboards. I looked at how teams separate hype from real value and found that the strongest choices lean on governance, explainability, and predictable cost. The biggest value comes from platforms that let you trace data lineage end-to-end and enforce governing policies without slowing teams down. You’ll want to pair any pick with a clear data strategy and a plan for ongoing education, so analysts and engineers speak the same language. If you only act on one thing this month, prioritize a vendor that documents data sources and transformations in a single, auditable view.
A few headline picks still matter, like a tool focused on data lineage for regulated workflows and another that automates insights without requiring every user to learn SQL. Choose one that matches your team's maturity and your data risks, not the trend of the moment. The pattern is simple: start with governance, then layer in automation, then evaluate whether the tool scales with your ambitions. Act now to lock in a pilot with clear success criteria.
Backup strategy / What to try this week
- Evaluate one tool’s data lineage view and test cross-source traceability for three critical dashboards.
- Draft a one-page governance bite with data sources, owners, and update cadence.
- Try a lightweight automated insights feature on a 2-week sprint. Measure time saved per analyst.
- Note any friction points where a vendor’s explainability falls short and plan a second-stage evaluation.
- Confirm that links on this page may earn a commission.