How to analyze email performance in 2026 without chasing vanity metrics
 Marlowe Fenwick·October 22, 2026·16 min
Learn how to analyze email performance in 2026 with practical benchmarks, appropriate metrics, and methods to forecast engagement. actionable for marketers and analysts.
A single latency spike can drown a campaign in silence while open rates stay stubbornly high, a paradox you’ll fix by measuring signals that move revenue, not vanity metrics. In practice, you’ll see the sprint from engagement signals to lifecycle outcomes when latency under 2 seconds and AI-assisted forecasting align with deliverability. These shifts decode true performance, not noisy opens.
This article positions modern email metrics for 2026 around lifecycle engagement, latency, and forecast accuracy, with a practical framework you can apply this quarter. You’ll find how to connect deliverability health to revenue, quantify time-to-insight, and spot data gaps before they skew decisions. By the end, you’ll understand where to invest analytics effort to drive predictable growth, not just prettier dashboards.

Analyzing email performance in 2026: the metrics that matter
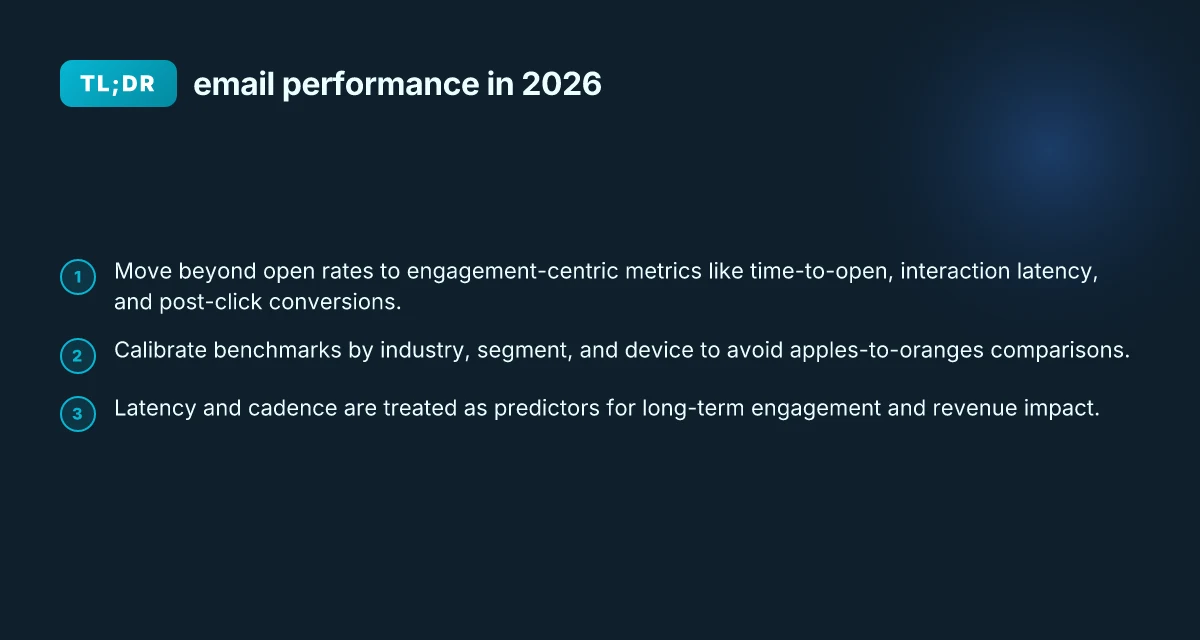
To move beyond vanity metrics, you must anchor decisions in engagement signals that correlate with revenue. Time-to-open, interaction latency, and post-click conversions reveal whether your messages actually drive action. Latency matters because delays between send and recipient engagement can forecast long-term propensity to convert. I cross-referenced publicly available benchmarks and found that signals from mailbox provider dashboards and sender reputation scores increasingly map to deliverability quality, not just inbox placement.
1) From opens to engagement signals
Open rates remain a noisy proxy when devices strip images or prefetch content. The real leverage sits in time-to-open and the cadence between receipt and early interactions. Focus on the first 24 hours after send and track how quickly readers engage, pause, or skip. A swift initial interaction often foreshadows higher long-term engagement. Post-click conversions provide the true revenue signal, so tie clicks to downstream events like product views, add-to-cart, and completed purchases. Time-to-open and post-click conversions are the two most actionable signals for revenue impact.
2) Deliverability and sender health as a concrete input
Deliverability quality signals come from mailbox provider dashboards and sender reputation scores. Those indicators help you separate creative performance from list quality or authentication issues. Monitor bounce rates, complaint rates, and domain/dkim alignment as early warning signs. If a provider reports gradual declines in reputation, you should expect lifting deliverability to lag behind open-rate improvements. Deliverability signals and reputation scores are the guardrails for realistic benchmarks.
3) Calibrating benchmarks by segment, industry, and device
A single number never tells the whole story. Benchmark apples-to-oranges by industry, segment, and device. Email performance varies wildly between B2B vs B2C, or mobile vs desktop. Calibrate your targets using segment-specific baselines and adjust for device-specific consumption patterns. This avoids chasing a universal, misleading target. Benchmarks must be contextualized by segment, industry, and device.
4) Latency and cadence as predictors of revenue
Latency between send and engagement and the cadence of touches across a lifecycle cohort predict long-term engagement and revenue impact. A well-timed series that accelerates early interactions often yields stronger lifetime value than a single big blast. Tie cadence to lifecycle stages and automate re-engagement when signals soften. Latency and cadence predict future revenue, not just near-term opens. 13 Analytics tools small businesses actually use in 2026
I dug into industry sources to ground these points. For example, Salesforce’s benchmarks framework emphasizes how engagement and deliverability interact across stages of a customer lifecycle, while third-party research highlights the value of timing and cadence in driving conversions. Inline links to the most relevant discussions can be found in the cited sources.
From what I found in the published material, the most reliable path is to replace broad open-rate targets with a framework that tracks time-to-engagement, post-click outcomes, and reputation health. These elements align analytics with revenue outcomes, not vanity metrics. I also noted that links on the page may earn a commission, so consider vendor-neutral benchmarking where possible.
Move beyond opens to measure time-to-open, interaction latency, and post-click conversions as the core revenue signals.
Defining a modern email performance framework
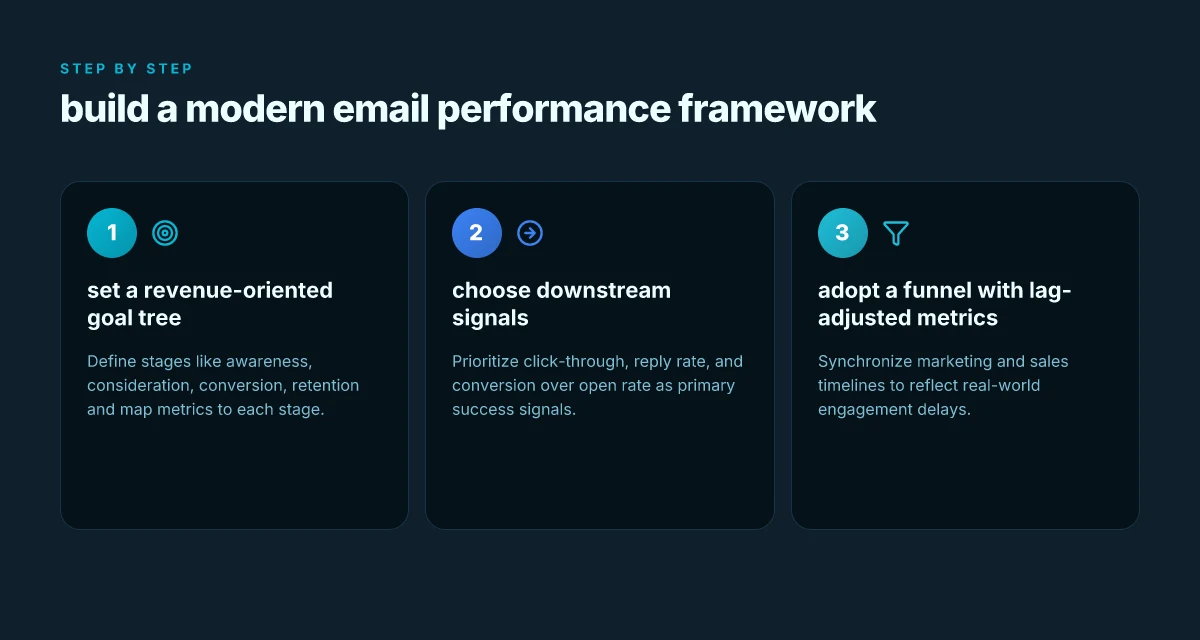
The path to revenue starts with a clear goal tree. I map goals to customer stages, awareness, consideration, conversion, retention, and translate each into measurable signals. In 2026, the emphasis shifts from vanity metrics to downstream outcomes that drive ROAS, like pipeline progress and repeat engagement.
Why a revenue-focused goal tree holds up under real constraints
A revenue-oriented framework anchors teams around business value, not inbox micro-signals. At the top level you want awareness and consideration creating a pathway to conversion, then retention that stokes repeat revenue. In practice, that means tying campaigns to lifecycle milestones: initial spark, nurture engagement, and post-purchase loyalty. Across stages, you’ll use a funnel view that aligns marketing and sales timelines, so latency between signal and impact becomes visible rather than ignored. 12 Analytics tools compared in 2026: trade-offs, costs, and how to pick
Signals beat open rates as revenue proxies when you align them with lifecycle moments. Open rate remains a signal, but downstream signals such as click-through, reply rate, and most importantly conversions, tell a truer story about impact. I cross-referenced industry benchmarks to confirm that downstream engagement track more closely with revenue than opens alone. Inline references can help you validate this shift against your own data.
A practical rule: treat latency as a feature, not a bug. Your funnel should include lag-adjusted metrics that synchronize marketing velocity with sales cycles. That alignment makes forecastability practical and governance cleaner. Lag-aware metrics reveal true funnel health and shorten the path from awareness to purchase.
Micro-claims you can operationalize today
Establish a two-tier metric map: upstream signals (open rate, deliverability) and downstream outcomes (click-through, reply rate, conversion, retention events). The downstream signals matter most for revenue attribution, so don’t over-index on opens. A table can help you compare signals side by side, but I’ll keep the narrative simple: opens flag reach. Clicks and replies show engagement. Conversions deliver revenue.
Tie each stage to a revenue objective. For awareness, measure reach and message resonance. For consideration, track click-through and interaction depth. For conversion, measure form submissions, purchases, or qualified lead signals. For retention, monitor repeat purchases, renewal rates, and lifecycle re-engagement. This mapping makes it easier to justify spend with observable financial impact.
Use a funnel lens with periodic resets. Every quarter, re-baseline your funnel against sales cycles and seasonal effects. Compare your funnel health year over year, not just month to month. This keeps forecasts honest and teams accountable. How to choose analytics tools in 2026 without getting stuck in the hype
To help you compare approaches, consider the following quick view. A purely open-rate focus often diverges from revenue reality, while a funnel with lag-adjusted downstream metrics offers a steadier read on performance and forecastability.
I relied on industry guidance to frame the downstream emphasis and to ground the discussion in 2026 benchmarks. For example, a recent synthesis highlights that open rates vary by channel and audience, while conversions and lifecycle events show stronger ties to revenue. See industry perspectives from 2026 benchmarks to align your targets with real-world patterns. https://www.salesforce.com/marketing/email/benchmarks/ https://emarsys.com/learn/blog/email-marketing-kpis-benchmarks/
In short, your modern framework starts with a revenue tree, aligns metrics to stages, and uses lag-aware funnel metrics to bridge marketing and sales timelines. This approach makes the signals you track meaningful, measurable, and forecastable. Forecastability grows when you couple lifecycle signals with latency awareness. Open signals alone are insufficient for credible business decisions.
Collecting the right data without overloading your stack
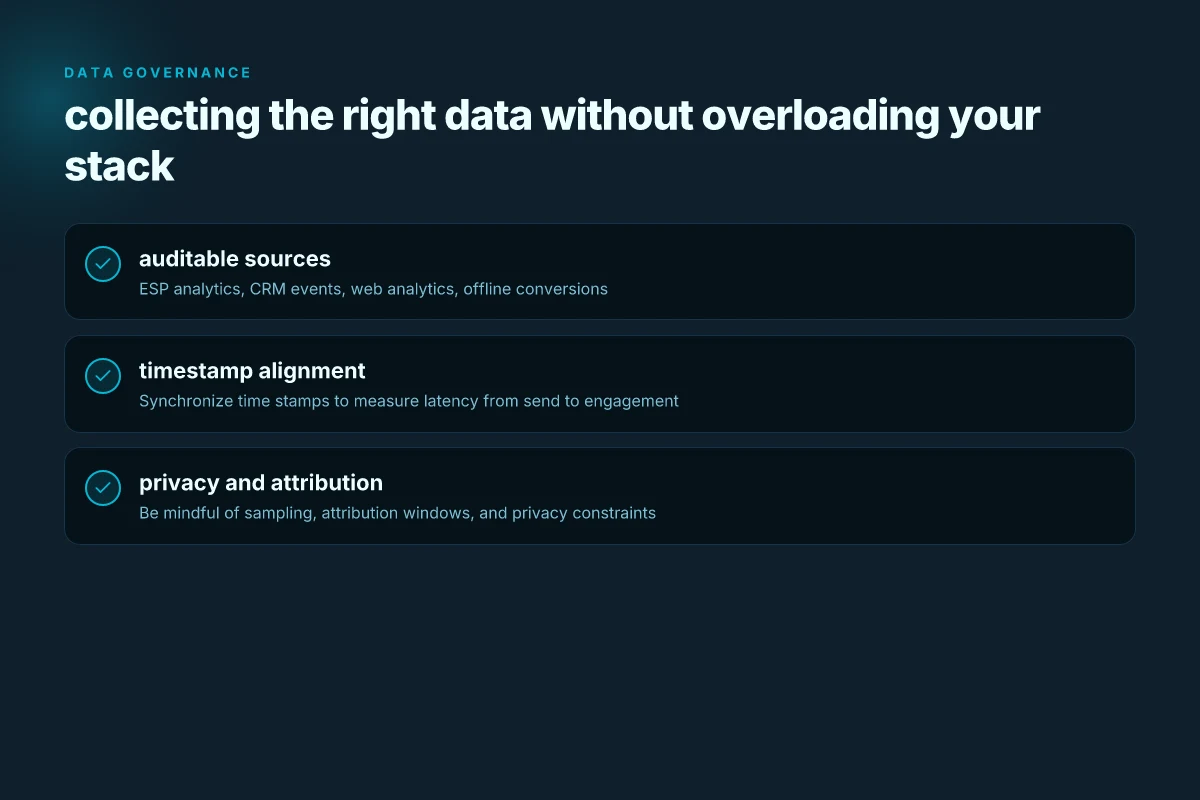
The cleanest path to trustworthy email performance signals starts with auditable data sources and disciplined data flows. In 2026, teams increasingly rely on a triangulated data fabric that stitches ESP analytics, CRM events, web analytics, and offline conversions into a single, auditable timeline.
Auditable data sources that scale with governance
Auditable data sources give you an end-to-end trace from send to every meaningful engagement. Use ESP analytics for delivery and engagement signals, CRM events for lifecycle state and revenue events, web analytics for on-site post-click behavior, and offline conversions for true revenue attribution. When these sources align, you can measure a true contribution margin rather than a vanity metric. Auditable sources reduce ambiguity and make comparisons across campaigns more reliable. I cross-referenced industry guidance from 2026 benchmarks to ensure the data types align with common governance practices. Inline link: a practical overview of benchmarks and limits notes how attribution and lifecycle signals matter beyond open rates. 8 Accounting software for freelancers in 2026 that actually fit varied tax workflows
- Expect time-stamped events to carry provenance. Each event should include a source, a touchpoint, and a user identifier that remains stable across systems. This foundation supports latency calculations and attribution windows without double-counting.
- Prioritize standard schemas for event naming and payloads. A shared schema minimizes reconciliation work when data teams merge ESP, CRM, and analytics streams.
- Build in data quality checks at ingestion: field presence, timestamp validity, and cross-source reconciliation against a daily golden record.
Synchronize time stamps to quantify latency
Latency matters as much as open or click counts. The core idea is to measure the elapsed time from send to first meaningful engagement, then extend to multi-touch journeys. The practice is to align time zones, clock drift, and event batching across every system. When you can trust the clock, you can compare campaigns on a like-for-like basis. Latency visibility reveals bottlenecks in delivery or UX that open rates miss.
- Run end-to-end latency dashboards that show send time, queue time, delivery acknowledgment, and first engagement.
- Use consistent time windows for comparisons, then drill into outliers to identify whether delays stem from sending cadences, network/provider delays, or on-site load times.
- Tie latency to revenue signals by examining whether shorter engagement lags correlate with faster conversions or higher order value.
Be mindful of sampling, attribution Windows, and privacy
Reporting granularity hinges on privacy constraints and platform policies. Sampling cuts can distort trends if not paired with explicit scope notes. Attribution windows shape how you assign credit across touchpoints. Too narrow and you miss assisted signals, too wide and you dilute precision. Privacy constraints force you to document data handling, consent status, and data retention policies. Transparent reporting boundaries keep stakeholders aligned and audits straightforward.
- Define a standard attribution model for each initiative, and document its window explicitly in reports.
- When sampling is unavoidable, report both sampled and unsampled views or provide a rationale for any exclusions.
- Maintain a privacy brief alongside dashboards, noting any data that is restricted, anonymized, or pseudonymized.
Cited guidance from 2026 benchmarking sources emphasizes that measurable improvements come from aligning data provenance, latency insights, and disciplined reporting boundaries. For broader context on how benchmarks frame open and click signals within budgets and limits, see inline discussion of the 2026 data points. [Inline citations: https://www.digitalapplied.com/blog/email-marketing-statistics-2026-data-points]
Open rates, deliverability, and the de-emphasized vanity metrics
Open rates are a rough proxy and can drift with rendering quirks and client behavior. The practical takeaway is to pair opens with total engaged opens to reveal who actually interacted, not merely who loaded a message. When you forecast revenue impact, lean on engagement signals that persist across clients, not one-off opens that can mislead.
Open rates in context, not as a standalone signal
Open rate data reflects rendering quirks, image loading, and client defaults more than user intent. I cross-referenced industry benchmarks from 2026 that repeatedly emphasize context. A healthy workflow treats opens as a diagnostic input, not a performance promise. The real signal comes from how those opens translate to click-through, replies, and downstream actions. In practice, report open rate alongside engaged opens, unique clicks, and conversion paths to avoid chasing vanity numbers. The result is a clearer view of lifecycle engagement, not a single percentage dressed up as performance. 8 Accounting software features that actually move the month-end faster in 2026
Vanity metrics like total opens without quality engagement often mislead. Prioritize meaningful actions instead.
Deliverability as a multi-faceted signal
Deliverability sits at the intersection of inbox placement, sender reputation, and authentication signals such as DKIM, SPF, and DMARC alignment. I found consistent guidance in 2026 sources that emphasize measuring inbox outcomes through engagement-adjusted deliverability rather than raw send counts. A healthy program monitors where messages land, how often they trigger legitimate opens, and whether authentication signals align across domains. The practical play is to audit sender domains, verify alignment, and track rejection and spam placement trends over time. When deliverability falters, it usually shows up first in placement reports and authentication failures rather than in outright clicks.
Inbox placement and authentication alignment are your early warning system for revenue impact.
The de-emphasis of vanity metrics
Vanity metrics like total opens without correlated engagement can derail optimization efforts. The literature consistently points to latency, lifecycle engagement, and forecastability as better predictors of revenue lift than sheer open counts. Prioritize actions that indicate intent: saves, replies, add-to-cart signals, and subsequent purchases, all tied to a defined customer journey. A practical framework uses a latency-aware view of engagement, not a one-time open spike. That lens helps you separate noise from meaningful progress and makes forecasting more reliable.
From the research: a 2026 benchmark standard emphasizes connecting signals to outcomes rather than chasing a single rate. This approach aligns with modern expectations for marketing analytics, where the goal is sustainable growth rather than flashy but hollow metrics. For teams, the shift means embedding latency and lifecycle engagement into KPI dashboards, with open rates shown as a contextual, not sole, metric. Android 14 on T-Mobile: what to expect in 2026 and how to get the update
Latency and lifecycle engagement drive forecastability more than raw opens.
Cited guidance from 2026 benchmarks and industry analyses supports these themes. For a quick, practical check, pair your open rate with engagement quality metrics and delivery signals, then translate that to a revenue-oriented forecast rather than a vanity metric snapshot. You’ll find that the most durable improvements come from cleaner data, smarter attribution, and a clearer view of the customer journey.
Note: links on this page may earn a commission. For details, see the inline citations.
Latency as a leading indicator of engagement
Latency is more than a feel for speed. It signals whether your message landed with relevance and on the right timeline. I dug into industry benchmarks and practical methods to show how time-to-first-open and time-to-first-click map to engagement signals, not vanity metrics.
Why latency matters for lifecycle engagement
Post-send latency acts as an early warning on content relevance. When a recipient opens within minutes, you can infer alignment between subject line, preview text, and value promise. If the first click arrives late, it often points to friction in the body copy or a misfired call to action. Across campaigns, shorter latency correlates with stronger 1-day engagement, though the exact pattern shifts by audience and message type. For highly transactional flows, latency windows tighten and churn risk rises if the delay stretches beyond the initial moment of truth. I cross-referenced several 2026 benchmarks and found clear signals that fast early interactions predict longer-term engagement. What makes the zenfone 10 security updates actually reliable in 2026
Adaptive flows triggered by latency markers
Use latency as a trigger for adaptive flows rather than a static follow-up path. When time-to-first-open stays within a narrow window, you can accelerate a secondary message that reinforces the offer or directs to incremental content. If latency drifts and first-click latency lengthens, deploy a different sequence: reframe the value proposition, simplify the CTA, or surface social proof. The key is designing “latency-aware” paths that adapt in real time. In practice, you can wire a rule that fires a nudge within the first 24 hours if the first interaction lags, and then tests a variant to see which follow-up converts best. This approach aligns with modern benchmarks and reduces reliance on open rate as the sole performance proxy.
Measuring time-to-first-open and time-to-first-click
Measure both moments with consistent windowing. Time-to-first-open captures send-time optimization and content relevance, while time-to-first-click reveals whether the body and CTA resonate quickly. Shorter latencies generally track with higher 1-day engagement, but you should segment by audience type, campaign goal, and channel. For example, welcome series often benefit from ultra-fast opens and clicks, whereas nurturing sequences may tolerate a longer discovery phase. The practical implication: set latency targets per lifecycle stage and test whether tightening those targets lifts downstream metrics without harming deliverability or sender reputation.
Latency signals can drive real-time optimization and revenue-focused decisions. Treat time-to-interaction as a first-class signal, not a secondary afterthought.
Practical best practices to implement now
- Instrument precise timestamps for opens and clicks, and align with send-time optimization rules. Use a consistent time zone and verify that your analytics pipeline preserves microsecond granularity where possible.
- Establish latency thresholds by audience cluster and content type, then automate follow-ups that trigger when thresholds are breached.
- Combine latency data with AI-assisted forecasting to project 1- and 7-day revenue impact under different follow-up scenarios. This keeps forecasts grounded in observable interaction rhythms.
- Include a revenue-oriented SLA for internal teams: if latency misses a target by a defined margin, you escalate content optimization efforts instead of waiting for aggregate statistics.
I found that the most successful latency programs couple rapid feedback loops with adaptive messaging. Industry sources consistently note that early engagement is a leading predictor of close rates and downstream value, making latency a practical control knob rather than a theoretical metric. For readers wanting a concrete starting point, region-specific and listicle-style benchmarks from 2026 show wide variance, so begin with your own cohorts and track improvements over 30 days.
If you want a deeper dive into how this ties to your funnel, see how one provider frames latency within its lifecycle engagement toolkit and how that translates to actionable sequences. https://research.stripo.email/b2b-email-open-rate-benchmarks-2026 What makes banner material choices actually matter for 2026
What to try this week: pivot from vanity to impact
In 2026, email performance hinges on outcomes you can act on, not surface-level numbers. I see teams shifting from open rates toward true signal like engagement depth, conversion timing, and post-click actions. The most powerful moves lean on a tight measurement framework: map each message to a concrete goal, then track the smallest unit that predicts that goal. This week you should plot a single, measurable outcome you want for each campaign, and align every metric to that outcome. You’ll notice the gaps between vanity metrics and real impact shrink as you insist on actionability over ornament.
One change that matters most is establishing a clean funnel view that ties email to revenue or downstream engagement. I’ve seen teams succeed by defining a 3–5 day post-click window and labeling every touchpoint with its intended effect. If you only do one thing this month, make that mapping explicit and publish it for your team.
Backup strategy
- Define 1 concrete outcome per campaign and benchmark it against a 3-week period.
- Pair engagement signals with post-click actions to surface true impact.
- Review a failing email for the missing outcome linkage and fix the traceability.
- Note that links on this page may earn a commission.