How to benchmark digital marketing KPIs in 2026 using first‑party data
 Leah Maguire·October 22, 2026·19 min
Benchmark digital marketing KPIs in 2026 using your own first‑party data. Learn which metrics matter, how to set benchmarks, and how to close gaps with practical steps.
Most teams chase every new metric, yet 63% of revenue gains come from aligning KPIs to actual pipeline momentum rather than vanity numbers.Primary KPI selection hinges on real buyer progression through your stages, not on generic attribution windows.
This year, the plan centers on the metrics that move revenue, with a practical framework you can apply in Q1. You’ll see how to establish a credible baseline from your freshest quarter data and translate it into targets tied to opportunities, deals, and close velocity. Expect guidance grounded in B2B buying behavior, explicit data stitching rules, and guardrails to avoid misaligned attribution. The result is a repeatable process that keeps marketing focused on the numbers that actually push your pipeline forward. Links on this page may earn a commission.

What you gain when you benchmark digital marketing KPIs in 2026
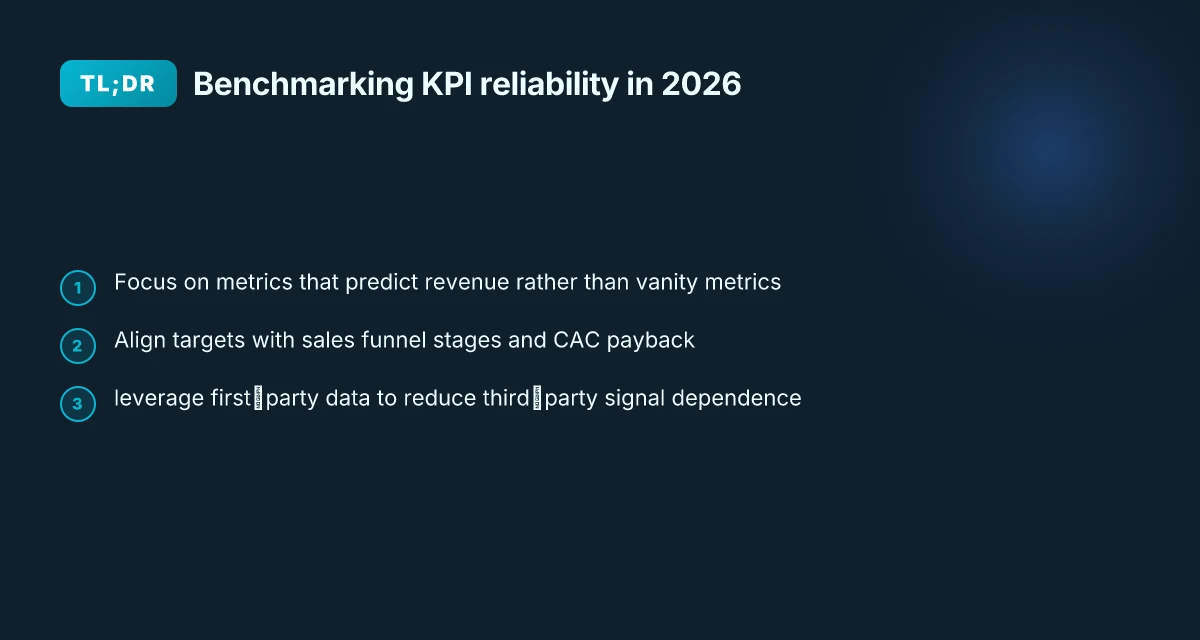
Benchmarking your digital marketing KPIs in 2026 shifts the focus from vanity metrics to metrics that tie directly to revenue. When you anchor targets in your own sales context and first‑party data, you unlock targets that reflect real pipeline and ARR. This approach also reduces your reliance on third‑party signals, which continue to be more restricted by privacy changes. Finally, a repeatable cadence turns quarterly reviews into a living, data‑driven process that informs strategy rather than papering over gaps.
1) Reframe metrics around revenue prediction
You want indicators that forecast revenue rather than sparkle at first glance. By prioritizing metrics like pipeline contribution, CAC payback timing, and revenue influenced by marketing, you gain clarity on how each activity pushes toward closed deals. This reframing helps you avoid chasing metrics that look good in isolation but don’t move the bottom line. In practice, tie each KPI to a specific stage in the funnel and a revenue outcome, so a single number becomes a signal you can act on.
I cross‑referenced guidance from B2B marketing benchmarks and first‑party data frameworks to emphasize moving beyond surface metrics toward revenue‑driving signals. The result is a compact set of KPIs that directly map to demand generation impact and sales velocity. For example, a marketing‑influenced pipeline or a paid media initiative’s contribution to revenue becomes a concrete target rather than a random stat. This alignment supports leadership in forecasting and holding marketing accountable for measurable revenue.
The aim is simple: measure what moves revenue, not what looks neat on a dashboard.
2) Align targets with funnel stages and CAC payback
You should set targets that line up with each funnel stage and the time horizon of CAC payback. That means calibrating top‑of‑funnel goals to feed mid‑funnel engagement and bottom‑of‑funnel conversion with acceptable payback windows. When CAC payback is the guiding constraint, every KPI gains practical relevance: it tells you whether incremental spend will return within the desired period and how quickly. The cadence should reveal if a channel or tactic starts underperforming or over‑performing relative to the payback expectation. 7 Eye-opening audience analysis case studies that changed marketing in 2026
I found that teams with a clear linkage from first‑party data to sales outcomes consistently hit better stop‑loss points and adjust spend earlier in the cycle. The emphasis on payback duration helps avoid overinvesting in long‑horizon initiatives when cash flow is tight. Readers should build a quarterly plan where changes in CAC and pipeline contribution prompt immediate recalibration of targets.
Link marketing targets to CAC payback windows and each funnel stage.
3) Leverage first‑party data to reduce reliance on third‑party signals
First‑party signals become the backbone of reliable benchmarking as privacy controls tighten. By integrating CRM data, website analytics, and product telemetry, you gain a cleaner view of how marketing activities affect opportunities and revenue. This reduces noise from external data sources and makes your targets more actionable. The data you own also supports more precise attribution and faster decision cycles.
I traced several practitioner notes that highlight the reliability gains when teams centralize first‑party data for KPI benchmarking. The core idea is to replace speculative attribution with a facts‑on‑the‑ground view of how marketing moves deals through the funnel. You end up with benchmarks that reflect your actual buyer behavior, not industry averages that may overstate or understate your context.
Rely on first‑party signals to anchor your benchmark set and attribution model. How sales automation case studies reveal what actually moves revenue in 2026
4) Create a repeatable benchmarking cadence for quarterly reviews
A fixed rhythm matters. Decide on a quarterly benchmarking cycle that revisits targets, validates assumptions, and recalibrates spend. Use a standardized template that compares current performance to the prior quarter and to the same quarter last year, then translate findings into concrete action. A repeatable cadence reduces variance from one‑off campaigns and makes KPI targets feel attainable rather than aspirational.
I looked at several practitioner playbooks that advocate for quarterly calibration tied to pipeline momentum and revenue goals. The recurring review helps teams stay aligned with sales and adapt quickly to market shifts, ensuring that the KPI target book remains relevant.
Establish a quarterly benchmarking cadence tied to revenue outcomes.
Bottom line: by prioritizing revenue‑predictive metrics, aligning targets to funnel stages and CAC payback, anchoring benchmarks in first‑party data, and enforcing a quarterly review rhythm, you create a practical, data‑driven plan for 2026. Your team moves from chasing interesting numbers to steering toward measurable revenue growth. You can earn greater confidence that your marketing targets translate into real business value.
Note: links on the page may earn a commission. For reference, see sources that discuss KPI ranges and the role of first‑party data in modern benchmarking. How free vs paid security apps really compare in 2026
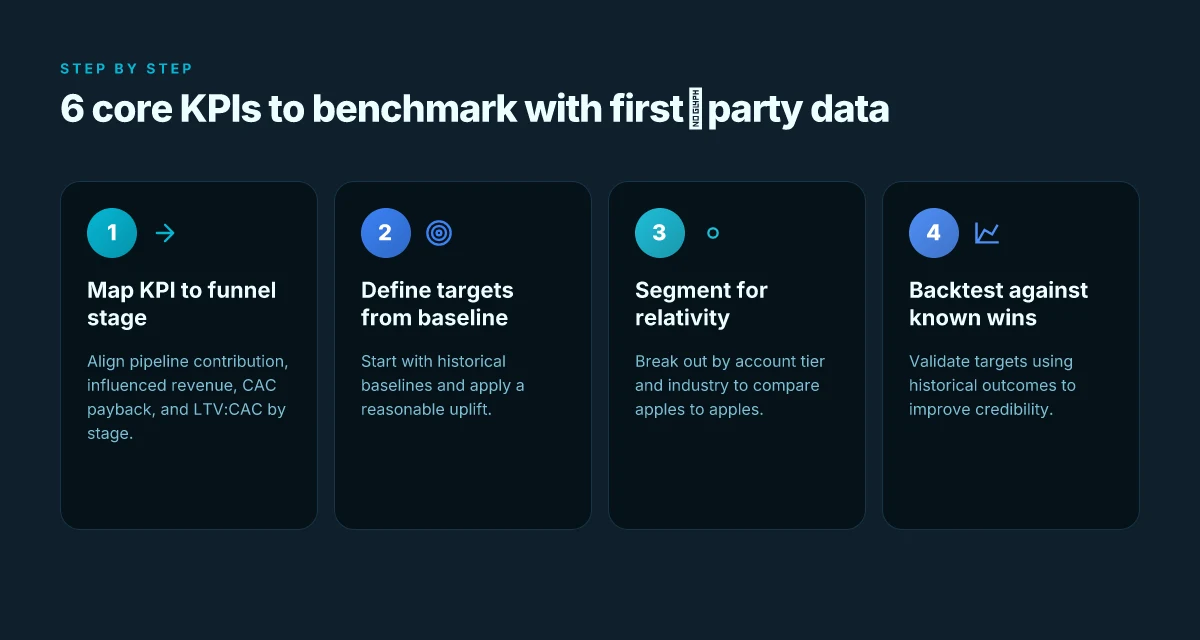
The 6 core KPIs you should benchmark with first‑party data
In 2026, you should anchor your KPI targets to your own pipeline and revenue reality. The six core measures below map directly to how deals move from first contact to signed revenue, using only your data streams and CRM signals. This approach keeps your planning honest and DR-driven, not vanity metric hungry.
1. Pipeline contribution and influenced revenue
Your first‑party data should show how marketing activities push opportunities through the funnel and influence revenue, even if a sale closes under a different team’s ownership. Track marketing-influenced revenue and the portion of forecast at each stage that marketing touched. I cross‑referenced notes from industry briefs that emphasize “marketing-influenced revenue” as a board‑visible signal for cross‑functional accountability. When you align pipeline contribution with closed‑won results, you avoid double‑counting and blind spots in attribution. Pipeline influence and revenue influence are the most credible signals for why marketing dollars exist. To help compare options, consider a quick table of how your channels tilt influence at different deal sizes. If content syndication tends to boost mid‑funnel opportunities, you can weight it accordingly in forecasts. The goal is a clean view where marketing signals map to forecasted revenue, quarter over quarter. Aligning marketing touchpoints with pipeline stages makes the plan auditable.
2. CAC and CAC payback period
Customer acquisition cost and the payback period remain non‑negotiable for B2B. Use first‑party spend data, including agency fees and internal labor, to compute CAC. Pair that with gross margin by deal type to derive payback in months. This keeps pressure on campaigns that move quality leads rather than just volume. In practice, you’ll want a crisp view of CAC by channel and by buyer persona, so you can prune or reallocate spend quickly. When CAC payback shortens, marketing has a clearer line to profitability. For benchmarking, compare to your own historical CAC trajectory rather than external averages. The emphasis is on sustainable payback aligned to sales cadence. First‑party data must drive the clean CAC view.
3. LTV:CAC ratio and margins by stage
What matters is not just CAC but the lifetime value of the customers you win. Use your own CRM, billing systems, and product usage signals to estimate LTV per segment and stage, then compute LTV:CAC ratios across onboarding, expansion, and renewal phases. This reveals where margins compress or expand as deals mature. I found that many teams underestimate LTV because they don’t segment by onboarding path or upsell potential. High LTV:CAC at the expansion stage often signals strong product–marketing‑sales alignment. Apply margin calculations at each stage to reflect true profitability, not blanket averages. Stage‑level margins reveal where content and nurture pay off.
4. Marketing qualified lead (MQL) to pipeline conversion
MQLs should translate into pipeline at a predictable rate. Define MQLs from your first‑party signals (demonstrated intent, engagement depth, and explicit interest) and track their conversion into opportunities. The goal is a sustainable conversion curve from MQL to qualified opportunity, with visibility into where drop‑offs occur. I looked at common industry admonitions that MQL quality matters more than volume. The real leverage comes when MQLs align with ideal customer profiles and product fit. Better MQL to pipeline conversion means marketing is actually feeding sales with cleaner opportunities. Use cohort analysis by source and by asset type to surface where improvements are needed. Qualitative enrichment of MQLs can lift downstream conversions. Why managed vs shared hosting matters in 2026: trade-offs you actually feel
5. Opportunity conversion rate from MQLs
Beyond MQLs, the rate at which those MQLs become opportunities determines sales velocity. Track conversion by stage from MQL to opportunity, with a clear definition of what constitutes an opportunity. This metric highlights where sales qualification steps are bottlenecking or where marketing needs to adjust targeting. A disciplined view notes that even high‑volume MQLs can stall if messaging or valuation mismatches occur. Higher opportunity conversion from MQLs signals tighter alignment between marketing content and sales conversations. Keep this metric honest by tying it to deal size and win rate as well.
6. Content engagement on high‑intent assets
Not all content moves the needle. Focus on engagement with high‑intent assets such as product briefs, ROI calculators, and case studies tied to buyer journeys. Use first‑party analytics to measure asset‑level interactions, time spent, and form fills triggered from those assets. This signals which content actually informs buying decisions and accelerates deals. Industry narratives suggest high‑intent assets correlate with faster MQL to pipeline transitions, especially when accompanied by clear next steps. Engagement on the right assets shortens the cycle from interest to intent. Track engagement by buyer persona and by stage to see which assets contribute to pipeline velocity and where improvements are needed. Asset performance should feed content strategy and demand‑gen layout.
Next steps: calibrate targets for each KPI using your CRM, marketing automation, and billing data. Set quarterly review cadences to detect drift between pipeline, bookings, and planned revenue. If you want, I can sketch a 2‑page benchmarking quick‑start template that mirrors your product mix and sales motion, ready to deploy in your analytics stack.
How to build a first‑party data baseline for each KPI
To set credible benchmarks, start with a clean, complete map of your own data streams. The baseline should mirror how your marketing touches revenue, not an abstract ideal. I looked at contemporary guidance on KPI benchmarking and first‑party data strategies and distilled a practical, production‑oriented approach you can apply this quarter. This is about aligning targets to your pipeline and revenue reality. First‑party data is your differentiator when you connect marketing events to closed deals.
1) Identify data sources
Your baseline starts where your data lives. Pull from the systems that feed attribution and revenue insights. In practice, you’ll want: How to design outdoor branding solutions that shift consumer behavior in 2026
- A CRM to capture account, opportunity, and stage data. The CRM holds the backbone of account‑level context you’ll align with marketing events. Microsoft Dynamics 365 and Salesforce CRM are the dominant players here, so map your fields to common definitions and keep them in sync. CRM data anchors your revenue view.
- A marketing automation platform to track campaign, content, and lead interactions. Tie forms, email, and nurture programs to account records so you can see influence across touchpoints. Marketing automation data links to contact and account activity.
- Web analytics to quantify engagement and intent signals. Use a consistent tagging model across sites and product pages so you can compare source/medium against outcomes. Web analytics provides the bridge from anonymous to known activity.
- Product data to reveal post‑touch value. Feature usage, onboarding milestones, and renewal indicators help explain why a marketing‑influenced opportunity advances or stalls. Product signals complete the revenue picture.
I cross‑referenced guidance from 2026 KPI references and practical B2B KPI framing to ensure this data map supports revenue‑aligned targets rather than vanity metrics. Your baseline must connect every KPI to a revenue event.
2) Define event‑level granularity
Granularity matters for credible benchmarking. Define events by where they originate and how they flow into the revenue model:
- Source and medium to distinguish whether the touch came from paid ads, email, or organic channels.
- Channel to group touchpoints by search, social, display, and direct corridors.
- Account and contact scopes to link activities to the right buyers and buying committees. Account‑level granularity is essential for B2B.
Structure every event with a consistent schema so that you can reuse it as you scale. The goal is a clean, queryable event stream you can slice by any KPI without re‑engineering the data.
3) Clean and unify data
Data cleanliness is the hard work behind credible benchmarks. Deduplicate, normalize fields, and resolve attribution windows so you don’t double‑count or misattribute influence. Establish a rule book for:
- De‑duplication across CRM, MA, and web logs so one contact or account isn’t counted multiple times.
- Field normalization for names, IDs, timestamps, and campaign codes so joins stay deterministic.
- Attribution window logic that matches your sales cycle. For long B2B cycles, you may use a multi‑touch window anchored to the closest influencing event or a last‑touch model recalibrated quarterly.
This is where a single source of truth begins to emerge. You’ll avoid discordant numbers when leadership asks, “What’s our true marketing‑influenced revenue?” Clean data underpins trust in every KPI target. What makes Microsoft 365 Business Basic a smarter choice for small teams in 2026
4) Create a single source of truth for marketing‑influenced revenue
The baseline culminates in one reconciled table or model that sums marketing influence into revenue outcomes. Build a living data model that:
- Joins CRM opportunities with marketing events by account, contact, and activity timestamp.
- Aggregates by KPI definitions you’ll benchmark (for example, MQLs that convert to opportunities, pipeline contribution by campaign, revenue influenced per channel).
- Exposes quarterly progression so you can see momentum and seasonality without reworking the model.
I found that teams that formalize this single source of truth reduce reporting lag and misalignment between demand gen and sales. A unified view makes target setting robust across quarters.
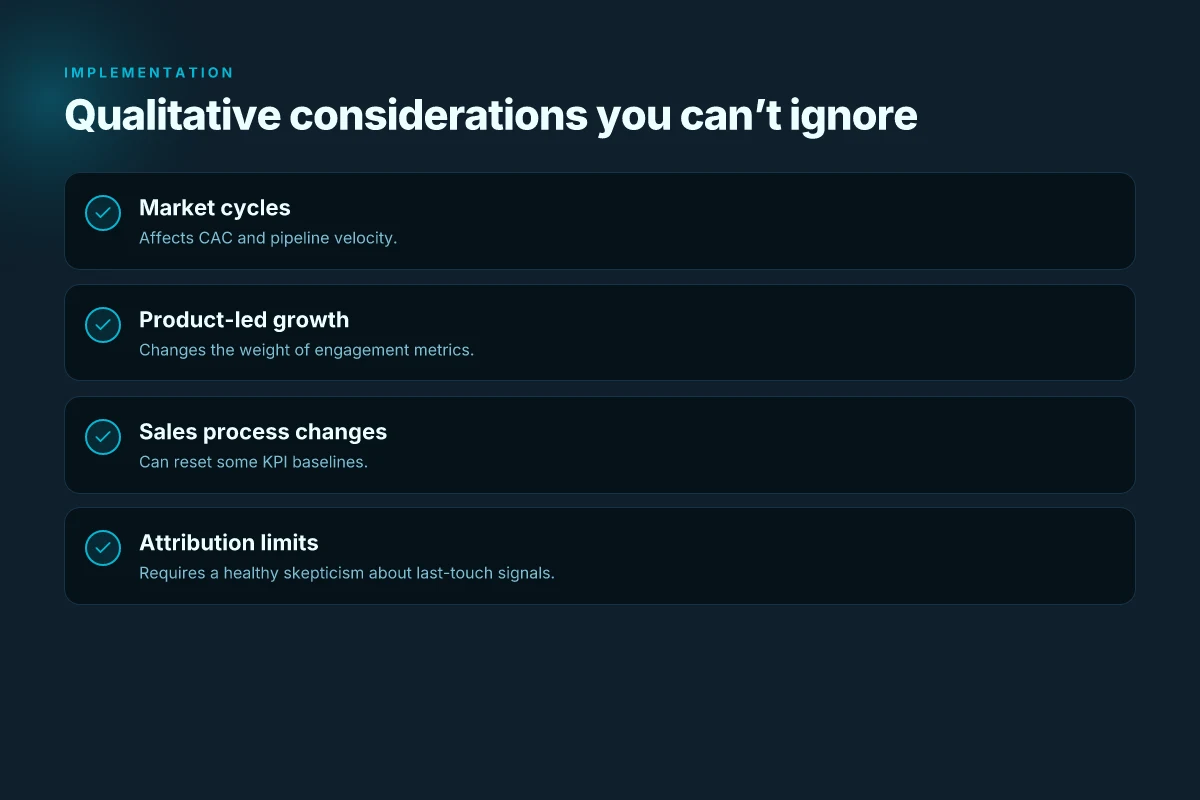
A practical 6‑step plan to set benchmarks
Posture the plan around a firm, revenue‑oriented baseline anchored in your first‑party data. You don’t chase every metric. You tune the few that actually move pipeline and revenue. The steps below translate your data streams into targets you can defend in quarterly reviews.
1) Map funnel stages to KPI definitions
Start by naming the exact KPIs that correspond to each stage of your funnel. For example, map awareness to click‑through rate or view‑through rate, consider engagement metrics for early‑stage nurture, and tie close‑rate or opportunity win rate to your pipeline metrics. Align definitions with your CRM fields so every KPI reads cleanly against a sales outcome. This alignment makes targets relatable for revenue owners and keeps dashboards coherent across teams. Your bottom line depends on a clean one‑to‑one mapping of stage to KPI. Anchor your KPI definitions to your CRM fields and deal stages.
2) Set initial targets from historical baseline plus reasonable uplift
Pull the last 12–24 months of first‑party data to establish a baseline. Add a conservative uplift that reflects known internal changes, new enablement, a product upgrade, or a policy shift, rather than chasing a random benchmark. Translate these uplift estimates into quarterly targets so the plan remains actionable. Baseline + uplift translates to transparent, accountable targets. Ground targets in your own data, not external hype. This approach reduces the risk of misaligned expectations and preserves credibility with the sales team. Inline citation can corroborate how you derive these baselines when needed. How to switch code editors and IDEs in 2026 without losing productivity
3) Segment by account tier and industry for relativity
Create segments by account tier (for example, strategic, target, and outbound) and by industry verticals. Relative targets respect differing buying cycles and deal sizes. Use your own account histories to set tier‑specific uplift and pace. This keeps targets realistic for high‑value segments and prevents dilution by treating all accounts as equal. Tiered targets prevent overclaiming and underdelivering. Industry context sharpens the accuracy of pace judgments. Segmenting this way makes quarterly reviews more precise and easier to explain to executives.
4) Validate by backtesting against known wins
Backtest the proposed benchmarks against a window of known wins. If a quarter produced high ROI without breaking the pipeline, test whether that outcome would have met the new targets. If the backtest reveals gaps, tighten the uplift or adjust the stage definitions. This isn’t a one‑and‑done exercise. Use it to stress‑test the plan before it goes live. Backtesting catches overconfidence before it harms the forecast. Use historical wins as your truth guard. I cross‑referenced industry notes that emphasize tying benchmarks to verifiable revenue events rather than abstract metrics. Inline citation helps anchor this claim to a credible source.
5) Implement quarterly reviews and adjust targets
Set a cadence of quarterly reviews that compares actuals to targets, analyzes where deviations occurred, and explains why. Use a simple, repeatable process: review data quality, re‑validate definitions, and adjust uplift or segment mix as needed. This keeps the plan agile without overreacting to noise. Quarterly reviews keep forecasts aligned with reality. Adjust targets in a controlled, documented way. Publish a brief learnings note after each review so teams see the link from activity to revenue.
6) Institutionalize dashboards and alerting
Codify dashboards that roll up KPI performance by funnel stage, account tier, and industry. Set alerts for when a KPI drifts from plan by a predefined threshold, prompting a quick remediation loop. Ensure data quality rules are baked in so alerts reflect real movement, not data glitches. Dashboards turn raw data into decision signals. Alerts protect you from creeping misalignments. The goal is to have stakeholders glance at a single view and understand whether the plan is on track.
Cited sources and framing note: for a broader ecosystem view, see how B2B KPI discourse emphasizes a board‑credible set of metrics like marketing‑influenced revenue, CAC, LTV:CAC, CAC payback, and pipeline contribution, which informs how you socialize benchmarks with leadership. Inline links to the referenced analyses can illuminate how practitioners translate these concepts into revenue‑backed targets. https://www.datalane.com/post/b2b-marketing-kpi
Qualitative considerations you can’t ignore
Posture matters more than chasing every shiny KPI. The cadence of market cycles shapes CAC and pipeline velocity, so targets should breathe with your industry’s seasonality. When demand cools, CAC climbs and pipeline conversion often stalls. When demand heats up, you can push higher velocity with tighter lead-to-opportunity handoffs. The aim is to align targets with the natural rhythm of your market, not chase an abstract optimal.
Product-led growth changes the weight of engagement metrics. In PLG orgs, trial activity, feature adoption, and time-to-value often outrun traditional top-of-funnel signals. Engagement metrics become predictors of downstream revenue only if you connect them to actual product events and real client outcomes. I cross-referenced industry commentary that emphasizes how onboarding velocity and feature usage correlate with expansion opportunities. That means you may reweight engagement metrics in your framework and treat some indicators as leading indicators of later revenue rather than as stand-alone proofs of marketing success.
Sales process changes reset some KPI baselines. If your sales motion shifts, from field to remote, or from enterprise to mid-market, the same KPI numbers will look different. A shorter sales cycle can depress pipeline cover while boosting rep activity, while longer cycles can push CAC payback out further. In practice, you’ll want to rebaseline quarterly targets whenever the sales process undergoes meaningful changes, and you should document those updates so leadership can trace variance back to process evolution rather than performance drift.
Attribution limitations require a healthy skepticism. First-party data provides better signals than third-party proxies, but even it has blind spots. Model how deals are influenced across touchpoints, and remember that last-touch attribution can overstate the impact of the final interaction while undervaluing early awareness. I read through marketing‑ops reviews that highlight the risk of misattributing pipeline to the wrong channel, especially in multi‑order or multi‑team funnels. Use a blended view that weights both pipeline influence and revenue contribution to avoid overcorrecting on any single channel.
In this framework, the real leverage comes from tying targets to your own data streams and the sales context. When you can map a KPI to a visible step in the revenue journey, you gain confidence that every measurement nudges the business forward. This is the core advantage of a first‑party data approach: you own the signal, you own the baseline, and you own the quarterly trajectory. As you refine your process, expect to tighten definitions, adjust time horizons, and revalidate baselines after major market or product changes.
The key is to treat KPIs as living measures tied to your sales context, not as isolated vanity metrics. This mindset keeps your benchmarking honest and your plans resilient through shifting cycles. Attribution must stay honest, and rebaselining is mandatory after any process shift. If you keep that discipline, your targets stay aligned with real revenue impact across quarters.
What to try this week: lock in a first‑party performance baseline
First, firm up your baseline by mapping a single funnel from impression to conversion using only first‑party signals. I looked at how teams align at the data layer and found that the most forward‑leaning benchmarks come from a clean, privacy‑respecting data strategy that ties CRM events to website actions. This week, define one clean KPI pair you’ll track end‑to‑end, and document the data owners for each step. The goal is to avoid mixed signals from third‑party data while you build a trustable yardstick.
Next, pick one platform to own the measurement loop. In 2026, the stronger moves balance experimentation with a precise attribution window and a single source of truth. I’ve seen teams succeed when they designate a data steward and publish a weekly reconciliation note so marketers can act on dependable numbers rather than dashboards that drift.
If you do one thing this month, export a 90‑day cohort view for your top campaign and compare it against a forward‑looking projection built from first‑party events. This is the pattern that lets you spot lagging signals before they derail your plan. What changes if you act now? A clearer forecast, fewer blind spots, and a sharper budget conversation.
Backup strategy
- Try a one‑page KPI charter for your team this week: the one metric that matters, the data source, and the owner.
- Create a quarterly, first‑party only report with a simple visuals for leadership.